
If you run a short-form channel, you already know the bad version of this problem. Five dashboards are open, the numbers don't agree, one video spiked fast, another is still climbing, and you still can't answer the only question that matters, what should I make next?
That's where content performance tracking gets real. It stops being a reporting habit and becomes a decision system, one that helps you tell the difference between a clip that looked good in the app and a clip that moved your channel forward.
Why Short-Form Creators Track Performance Differently
A blog editor can wait a few days and still make a sane call. A short-form creator usually can't. TikTok can hit hard early and fade just as fast, YouTube Shorts can keep collecting views long after the post date, and Instagram often rewards content that gets saved or shared for later, which changes what “good” looks like in the first place.
I've watched creators stare at platform-native dashboards and still miss the answer. A TikTok video with a strong first-day burst can look like a winner until the curve falls off. A YouTube Short can look mediocre on day one, then outlast the rest of the batch. A Reel with modest views can still be the one people keep saving because it stays useful.
The old web-analytics mindset isn't useless, it's just incomplete. The shift from simple page views toward broader engagement, traffic source, and conversion measurement is what made modern content tracking more useful in the first place, and that same logic applies here too, only the distribution curve is shorter and messier. The foundation came from the rise of web analytics platforms in the late 1990s and early 2000s, then Google Analytics launched in 2004 and later became widely used, which pushed teams toward multi-stage measurement instead of a single vanity count, as summarized in Semrush's content performance overview.
Practical rule: platform dashboards tell you what happened inside one app, not what deserves your next creative slot. A unified view is what tells you which hook, template, or CTA should get the next test.
That's also why guidance meant for articles and SaaS pages often breaks down for creators. A more useful setup borrows the discipline of social media content planning but adapts it to the way short-form video moves across platforms, with different windows, different signals, and different decay patterns.
Picking KPIs That Map to a Real Business Outcome
Start with one business outcome, not a pile of metrics. If the goal is monetization, track the numbers that show whether people are buying or clicking through. If the goal is brand deals, track the signals that make a channel look repeatable and valuable. If the goal is audience growth, track the indicators that tell you whether the channel is compounding or just spiking.
The mistake most creators make is treating every metric as equally important. A view is not a strategy. A watch time graph is not a business outcome. A save is only useful if it connects to something you care about, like return visits, pipeline, product interest, or sponsor appeal.
Use leading indicators to predict the outcome you care about. Those are the early signals that move before revenue or subscriber growth shows up. For YouTube Shorts, a strong early hold can hint that the video will keep getting traction later. For TikTok, a healthy share pattern is a better clue that the algorithm may keep pushing the clip. For Instagram, saves often matter because they point to evergreen usefulness rather than one-time attention.
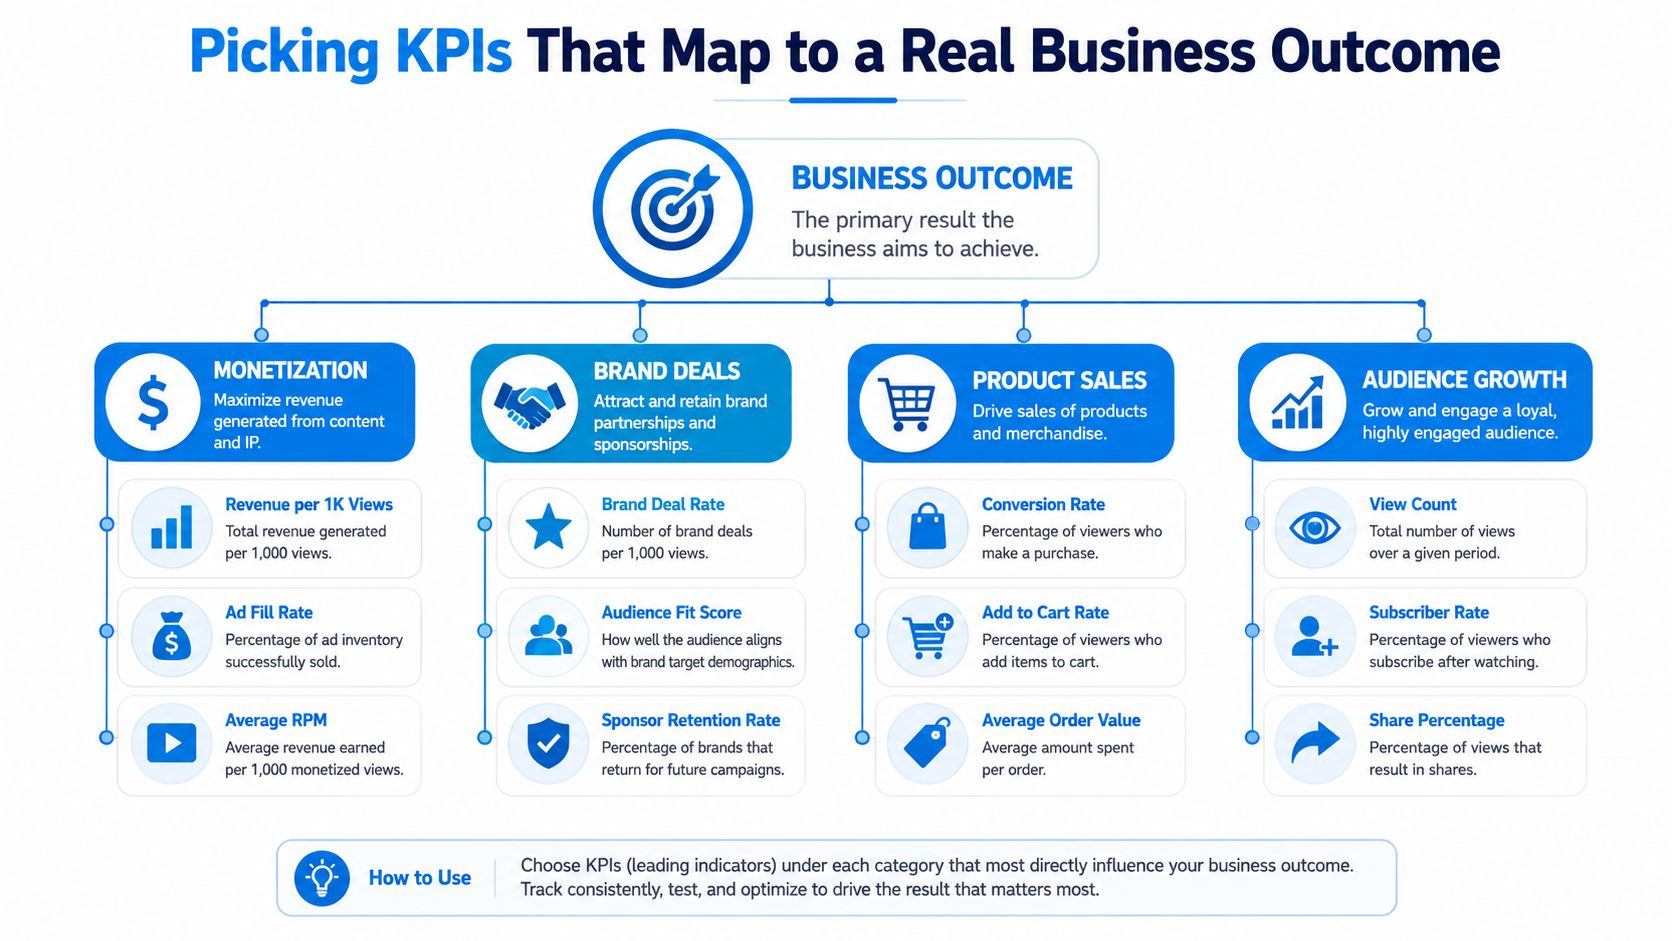
A simple KPI hierarchy
A clean way to choose metrics is to work from the outcome down, not from the dashboard up.
- Monetization: choose indicators tied to clicks, buyers, or repeat viewers who are likely to convert.
- Brand Deals: track proof that your content is consistent, audience-fit, and worth recurring spend.
- Product Sales: watch the paths that lead people from content to offer pages, storefronts, or affiliate links.
- Audience Growth: focus on the signals that show whether your content earns another session, another follow, or another share.
The same logic shows up in ecommerce KPI selection, where teams are told to anchor every metric to a business result instead of collecting numbers for their own sake. If you want a useful parallel, KPIs for ecommerce performance is a good model for thinking in outcomes first.
Keep the list tight. In practice, three KPIs per channel is enough for weekly review. More than that and the dashboard turns into a mood board. Fewer than that and you miss the reason one clip outperformed another.
Good weekly setup: one north-star outcome, two or three leading indicators per platform, and one revenue or pipeline metric that proves the content mattered.
For benchmark thinking, use the same principle. Compare like for like, not random spikes against random averages. That's the same reason performance benchmarking guidance is useful before you start making creative decisions off a single post.
Tagging and Instrumentation That Survives Real Production
Tracking falls apart when the creative library and the analytics export can't talk to each other. If you're posting fast, you need a tagging scheme that travels with the video everywhere it goes. The goal isn't elegance, it's survivability. A tag should still make sense when you open the spreadsheet two weeks later and barely remember what you were testing.
A lightweight convention is enough: template name, hook type, distribution source, and batch or publish date. Something like #tpl=cheating-fruits #hook=curiosity-gap #src=organic #batch=q4w2 gives you enough structure to compare creative choices without rebuilding the post from memory. That tag can live in the filename, the caption notes, and a shared sheet so the same logic follows the asset from draft to dashboard.
Build the tag where the work already lives
Don't create a second workflow just for tracking. Put the tag in the places your team already touches.
- Filename: keep the asset searchable before it ships.
- Caption notes: preserve the test logic beside the creative.
- Spreadsheet row: make the export joinable later.
- Platform notes or metadata fields: keep the posting context attached to the clip.
The reason this matters is simple. YouTube Studio, TikTok Analytics, and Instagram Insights all describe performance differently. A shared schema gives you a common language, so one row can include the platform view count, the hook type, the template family, and the revenue or affiliate result when it exists. That's the only way to stop arguing with three dashboards that all use different names for similar behavior.
A second layer matters too. Track the distribution source, then join the content row to storefront or affiliate records. Once that's in place, you stop debating whether a clip “did well” and start seeing whether it influenced buying behavior. That shift is the difference between content reporting and actual content performance tracking.
Implementation rule: if a tag can't survive copy-paste into a CSV, it's probably too complicated for a real production pipeline.
Building a Cross-Platform Dashboard That You Actually Use
Most dashboards fail because they try to impress you instead of helping you decide. You don't need every metric on one screen. You need the right metrics in the right layer. The cleanest setup is three parts: platform-native analytics, a third-party aggregator if you need broader reporting, and a unified dashboard that shows the creative decision alongside the outcome.
Platform-native tools are still useful because they show details no external tool can guess. TikTok, YouTube, and Instagram each expose their own signals, and you should keep them for source-of-truth checks. Third-party tools help when you need summaries across accounts. A unified dashboard is what lets you compare two versions of the same template without exporting three CSVs and manually matching filenames.
The minimum useful dashboard is boring in the best way. It needs views, watch time or retention, the leading indicators you picked earlier, and a revenue or pipeline field if the content affects sales. Anything else is optional until the core rows are reliable.
What a useful view should show
A creator dashboard should answer four questions fast.
- What shipped: title, template, hook, source, and publish date.
- What got attention: views and retention.
- What predicted future lift: the chosen leading indicators.
- What mattered to the business: sales, leads, affiliate clicks, or other pipeline influence.
That layout works because it keeps the creative side and the business side on the same row. You can compare two Shorts that used the same template but different hooks. You can isolate whether the TikTok version burned out early while the YouTube version kept climbing. You can also spot whether an Instagram clip did better in saves than in immediate views, which often changes how you package the next post.
A good reporting layer also keeps metadata stable. If one export says “curiosity gap” and another says “hook 1,” your dashboard is already lying to you. Standardized tags prevent that drift, and a unified view keeps the team from making decisions off platform-specific vanity totals.
For a more detailed reporting layout, this social media analytics dashboard guide is a useful reference point for how a cleaner reporting layer should be structured.
Running Experiments That Actually Move Numbers
The best creative tests are boring to explain and clear to read. Change one thing. Keep everything else fixed. Decide before you publish what counts as a win. That's the only way to avoid turning a test into a retrospective that can't prove anything.
A one-variable test can look like this: same template, different hook. Same hook, different background music. Same visual, different CTA. Each version should be tagged before it goes live, because after the post starts moving, memory gets fuzzy fast and everyone starts arguing from intuition.
The hard part is not launching the test. It's reading the early window without panicking. A viral post can wreck your average, especially if you treat every clip as equally representative. A small set of fast outliers will make weak creative look stronger than it is, and a slow-burn post can look bad before it has had time to mature.
Stop rule: decide in advance whether you're judging on a fixed window or a fixed sample of posts, then stick to it. Changing the rule after you see the result is how teams fool themselves.
If you want to speed up controlled tests, prompt cloning helps because it keeps the underlying creative constant while you swap a single element. That's the same discipline you'd want when testing Amazon product content too. If you need a useful outside example of A/B structure, Amazon listing optimization tips is a practical lens for thinking about controlled variation without changing the whole asset.
Read tests by what they reveal
The point of the experiment isn't to crown a winner forever. It's to learn what changed the curve.
- Hook tests: reveal whether the opening line earns attention.
- Template tests: show whether structure is carrying the message.
- CTA tests: show whether the video moves people toward a next step.
- Music or background tests: show whether pacing or mood changes retention.
For a practical walkthrough, the embedded video below is worth watching because it reinforces the value of controlled variation over random posting.
The cleanest experiment is the one you can repeat next week without debating what happened. When the setup is stable, the result is useful. When the setup changes every time, the metric is just noise with a chart attached.
Weekly Review, Monthly Deep Dive, and Automation
A solo creator or small team doesn't need a giant reporting ritual. It needs a cadence. The weekly review should be short enough that you'll do it, and the monthly deep dive should be deep enough that you don't miss decay or channel drift.
A good weekly review takes about twenty minutes. List what published, what won, and what should be repeated. Then check whether the winning clip won because of the hook, the template, or the distribution source. That's enough to decide the next batch without drowning in details.
The monthly deep dive is where the essential learning happens. Look at recirculation, decay, and pipeline contribution, not just raw views. The benchmark mindset matters here because content performance varies by format and channel, and the same absolute number can mean something different depending on what kind of post it was. Sources that focus on content analysis point to 5–10% month-over-month organic traffic growth as a practical reference for established programs, while content recirculation rates above 30% are often treated as strong and values below 20% can signal relevance issues, according to Outrank's content performance analysis guide.
Where automation helps without taking over
Automation should remove repeated admin, not judgment.
- Scheduled exports: pull data from each platform into one sheet on a set cadence.
- Threshold alerts: flag a post when it crosses the performance line you care about.
- Field normalization: keep naming and date formats consistent across exports.
- Fresh inventory: keep the production pipeline active so each month has enough new material to compare.
That last point matters more than people admit. If you don't publish consistently, your dashboard becomes a history lesson instead of a decision tool. Fresh content gives you a cleaner read on what changed, what held up, and what decayed.
The broader measurement shift is also important here. Current guides increasingly focus on first-party analytics and behavior signals across the journey, especially as privacy changes make single-source reporting less complete, and the smarter approach is to connect platform data with real audience intent instead of pretending one dashboard tells the full story. That's the measurement direction reflected in recent content tracking guidance, and it's the right mindset for creators who need the truth, not just a clean-looking chart.
Your 30-Day Starter Plan and the Myths to Ignore
Three myths waste a lot of creator time. First, views don't equal success. A video can get attention and still fail to drive revenue, leads, or audience quality. Second, copying a viral post doesn't guarantee reach, because the same format can fail when the hook, timing, or distribution source changes. Third, retention isn't the only metric worth tracking, because a strong watch curve still doesn't prove business value on its own.
A better heuristic is simple. Pick the outcome first, then choose the signals that show movement toward it. If the content supports product sales, track what helps the click or conversion. If it's for audience growth, track what predicts the next follow or return view. If it's for brand deals, track the signals that show consistency and repeatability.
A basic 30-day plan looks like this. Week one defines the business outcome and the KPIs. Week two ships tagged content so the tracking starts matching reality. Week three builds the dashboard and joins the rows to the right metadata. Week four runs the first real experiment and decides what to repeat.
If you want help turning that into a working creator system, Aicut has step-by-step tutorials and a Discord community built around shipping faster, tracking smarter, and keeping short-form production moving. Start with the tools that make your workflow lighter, then use the dashboard to prove what's working, not just what got a burst of views.
If you want a faster way to turn posts into a measurable system, Aicut gives creators the templates, automation, and unified tracking layer to do it without rebuilding the workflow from scratch. Use it to publish more consistently, compare creative versions cleanly, and stop guessing which clip deserves the next round of budget and attention.